tags:
Contents
LINUX TOP
The Linux TOP command provides valuable monitoring and troubleshooting information. However, there is a lot of information in a very condensed format and it can be tricky to sort through what is important and what isn’t.
This post was written using Ubuntu 16.04.2 LTS and TOP 3.3.10.
THE TOP OF TOP
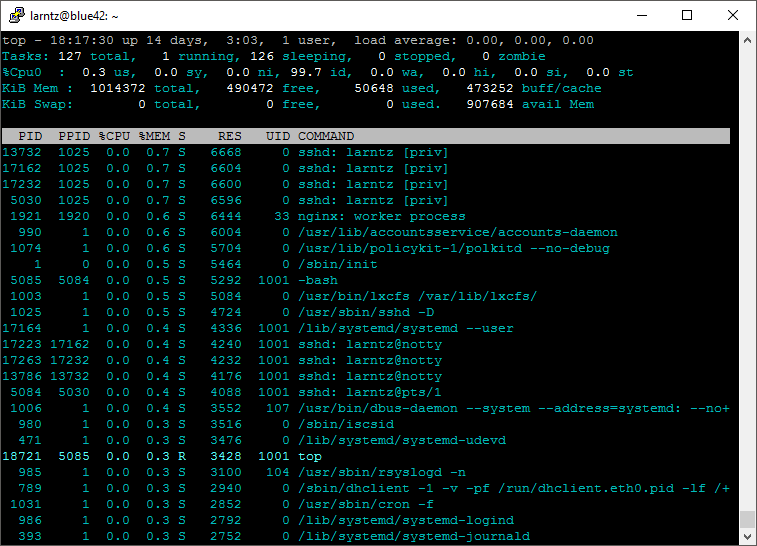
1. top - 18:45:48 up 14 days,  2:31,  1 user,  load average: 0.00, 0.00, 0.00
2. Tasks: 127 total,   1 running, 126 sleeping,   0 stopped,   0 zombie
3. %Cpu0  :  0.0 us,  0.0 sy,  0.0 ni,100.0 id,  0.0 wa,  0.0 hi,  0.0 si,  0.0
4. KiB Mem :  1014372 total,   490596 free,    50532 used,   473244 buff/cache
5. KiB Swap:        0 total,        0 free,        0 used.   907684 avail Mem        [
The first few lines of output from TOP give you a system overview. It shows up time, users, load average, CPU and memory statistics.
Line 1 shows the system time and up time (14 days). We see one user is logged in and our system load average is 0.
Note that load average is a 1:1 ratio per CPU. If you have 4 cores and your load average is 4 you are using your CPU to full capacity. If you go over to say 6 or 8 for a few minutes occasionally this should not be an issue. However, if your load average is 8 on a 4 core system for any lengthy period of time you can expect your system to run slow.
Line 2 shows Tasks (or processes). We can see here we have 127 total processes, 1 running, and 0 stopped or zombie processes. A running process is actively doing using CPU and a sleeping process is waiting for something to do. We’ll see later how to see which PIDs are in what state. Pressing t will alternate the Tasks display
A stopped process is a suspended process. This process has been suspended manually (CTR-Z) or could be being traced. Neither of these are a big deal, but if you have more than one or two stopped processes and you don’t know why there may be something goofy going on.
A zombie process is the coolest sounding process, but the uncoolest to actually have. This is a process that has finished (exited), but is still on the process table for some reason. Here again, having one or two isn’t going to cause you issues, but if you have more than a few it probably indicates something gone awry.
Line 3 here is our CPU stats. If you are on a multicore system you are going to have a line for each core. While top is running pressing 1 will switch between one line per core and one line for all CPUs.
There are some detailed CPU stats on this line also.
%Cpu0 : 0.0 us, 0.0 sy, 0.0 ni,100.0 id, 0.0 wa, 0.0 hi, 0.0 si, 0.0 st
- us: (user) time running un-niced user processes. These are normal user processes.
- sy: (system) time running kernel processes.
- ni: (nice) time running niced user processes. These are user processes that have been “niced.” This means the process has been given a higher or lower priority compared to an “un-niced” process.
- id: (idle) time spent in the kernel idle handler (time spent doing nothing).
- wa: (IO Wait) time waiting for I/O completion. This is time spent waiting for storage reads and writes. If this number is high it would indicate a storage problem.
- hi: time spent servicing hardware interrupts. This includes network overhead and other hardware interrupt overhead.
- si: time spent servicing software interrupts. These software interrupts are handled within the kernel.
- st: time stolen from this vm by the hypervisor. This is time spent waiting for the hypervisor to give our VM CPU time.
** Line 4** are the memory statistics. These are a lot more obvious than the CPU stats.
KiB Mem : 1014372 total, 490596 free, 50532 used, 473244 buff/cache
- total is the total system RAM. This system has 1GB of RAM.
- free is memory that is not allocated by the system.
- used is memory that is used by the system.
- buff/cache: the best description of this I’ve seen is at linuxhowtos.org Buffers are associated with a specific block device, and cover caching of filesystem metadata as well as tracking in-flight pages. The cache only contains parked file data. That is, the buffers remember what’s in directories, what file permissions are, and keep track of what memory is being written from or read to for a particular block device. The cache only contains the contents of the files themselves.
** Line 5** is related to swap space. This should normally be pretty low. I don’t seem much swapping on any current system. If used is high you probably need more RAM.
PROCESS DETAILS
I am generally only concerned with a few of these details. I set TOP on my systems to display the following information:
  PID  PPID %CPU %MEM S    RES   UID COMMAND
13732  1025  0.0  0.7 S   6668     0 sshd: larntz [priv]
 1025     1  0.0  0.5 S   4724     0 /usr/sbin/sshd -D
    1     0  0.0  0.5 S   5464     0 /sbin/init
- PID is the process ID. Most often this ID is used to kill or trace a process.
- PPID is the process’ parent process ID. This is the process that spawned this process. In our example above you can see that my sshd process was spawned by the sshd process which was spawned by init (PID 1).
- %CPU is the amount of CPU that process is consuming.
- %MEM is the percentage of RAM that process is consuming.
- S is the status of the process. This can be S, R, D, T, t, or Z. S = Sleeping, R = Running, D = uninterpretable sleep (usually waiting on storage IO), T or t = Stopped, and Z = Zombie.
- RES is the physical memory consumed by the process. This number is in kilobytes.
- UID is the user ID the process is running under.
- COMMAND is the command that the process is running.
CONCLUSION
There are a lot more features and options available when using TOP, but this covers most of what you need to know when looking at a system. If you are troubleshooting and you find an questionable area of the system you may need to refer to the TOP man page or use other tools to continue tracking the problem.